Sea charts with compass lines: from the portolan chart to the Dutch paskaart
The oldest surviving sea charts of the Mediterranean are covered with a web of straight lines. They are not decoration: from a ring of points the lines run in thirty-two directions, the directions of the compass. Here we explain how that web is built, how a pilot may have used it, where it goes wrong, and how chartmakers from Enkhuizen, Edam and Amsterdam made the Dutch paskaart.
The web of lines
The oldest surviving sea chart of this kind is the Carte Pisane, from the late thirteenth century; a more precise year cannot be given. Like the charts of the centuries after it, it is covered with what at first looks like a jumble of lines.
On closer inspection the lines form a regular pattern. Around one hidden circle, or two circles that touch, lie sixteen points at equal distances. Each point is joined to most or all of the others, so that thirty-two directions are repeated across the whole chart. The lines were drawn in different colours, to make it easier to pick the right compass direction.
In the middle of the fifteenth century the number of lines from the main centre was raised from sixteen to thirty-two. According to the historian Tony Campbell, the chartmaker Petrus Roselli seems to have been the first to do so, on his charts of 1449 and 1456.
How a pilot may have used it
To plan a course, the pilot first found his port of departure and his destination on the chart and drew a straight line between them. With a pair of dividers he then used the lines and the scale of distances on the chart to find the compass direction he had to hold, and how far he had to sail.
The historian Eric Ash adds a caution: no one knows for certain whether portolan charts were really used at sea in this way.
Where the straight line goes wrong
On a flat chart a straight line is not the track of a ship that holds the same compass course. On the round Earth such a course is a curve, a loxodrome. Distances on a flat chart are also wrong, because on the globe the meridians come together towards the poles, while on the flat chart they do not.
Campbell therefore keeps the old name rhumb lines only for convenience. The lines of a portolan chart would be true lines of constant course only on a chart drawn in Mercator's projection.
Gerard Kremer, better known as Mercator, solved both problems in 1569 with a world map on the projection that bears his name. On it every constant course is a straight line, at the same angle to the meridians as on the globe. The price is the scale, which grows from the equator towards the poles.
The English mathematician Edward Wright claimed to have found the mathematics on his own, and was the first to make the projection usable for navigation, in his book Certaine Errors in Navigation (1599).
The 32 points in Dutch
Dutch seamen divided the compass into thirty-two streken, or points. In his Zeemans-woordenboek of 1856, Jacob van Lennep describes a streek as one of the thirty-two parts into which the horizon is thought to be divided, and into which the compass really is divided. A ship that 'sails on six points' has only six points between the wind and its course.
The names are built from the four main points, Noord, Oost, Zuid and West, and their combinations; the word ten marks a quarter step, like by in English: Noord ten Oosten is north by east. One point is 11¼ degrees.
Noord ten Oosten
11.25° from north, 1 point clockwise
The names as Van Lennep lists them (1856). Tap or click a point, or use the arrow keys.
North Holland and the paskaart
In 1584 Lucas Jansz. Waghenaer of Enkhuizen published the Spieghel der zeevaerdt, the first book of sailing directions with charts in it. Marco van Egmond calls it the very first sea atlas in the world. The charts were meant for sailing along the coasts and entering ports, not for the open ocean.
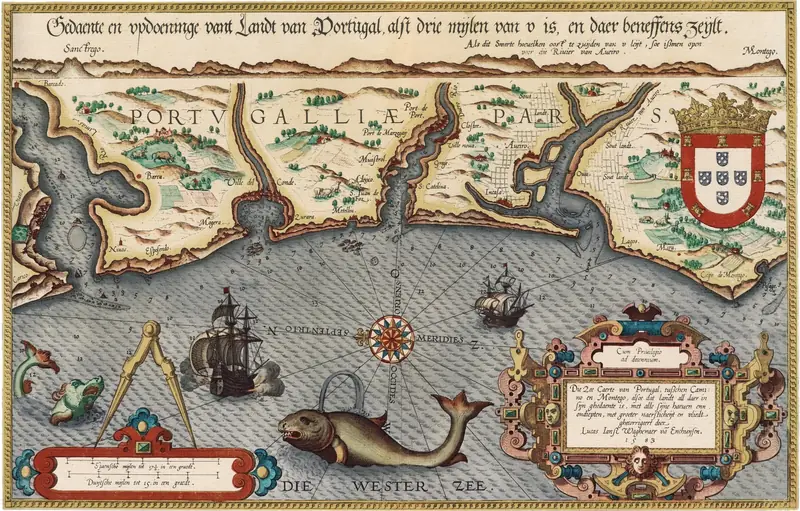
In 1592 Waghenaer's Thresoor der zeevaert followed, a mix of text, coastal profiles and charts. On those charts the coasts are drawn in profile, river mouths and harbours larger than life, and lines point towards landmarks. In 1608 Willem Jansz. Blaeu followed this example with his Licht der zee-vaert.
Around Edam and Enkhuizen worked what has been called the North Holland school of chartmakers. They drew charts by hand, both for use on board and to decorate the offices of shipowners and merchants. One of them, Cornelis Doetsz. of Edam, was chosen in 1611 as a special delegate to the Admiralty in Hoorn. Blaeu printed a chart of the coasts of Europe that Doetsz. had drawn.
From 1680 the Van Keulen family, first Johannes and later his son Gerard, dominated the publishing of sea charts in Amsterdam for almost two centuries. With the help of the mathematician Claes Jansz. Vooght, their publications were of high scholarly quality.
Such a chart was called a paskaart: according to Van Lennep, a sea chart on which the miles sailed and the courses are measured off with the dividers. The art of using it was taught from books such as 't Vergulde licht der zeevaerdt by Claes Gietermaker, first printed in 1660 and used in the training of pilots throughout the eighteenth century.
What we do not know
- Were portolan charts really used at sea in the way described above? Ash writes that no one knows for certain.
- When exactly was the Carte Pisane made? 'About 1275', 'about 1300' and 'about 1290' are all given; Campbell calls the last one an unwarranted assumption.
- Who drew the very first chart with a web of compass lines? The Carte Pisane is only the oldest that survives.
- What exactly does Edward Wright write? We have not read his book ourselves; what we say about it comes from Ash.
Sources
- Tony Campbell, 'Portolan Charts from the Late Thirteenth Century to 1500', in The History of Cartography, vol. 1 (Chicago 1987), pp. 371–463. press.uchicago.edu
- Eric H. Ash, 'Navigation Techniques and Practice in the Renaissance', in The History of Cartography, vol. 3, part 1 (Chicago 2007), pp. 509–544. press.uchicago.edu
- Günter Schilder and Marco van Egmond, 'Maritime Cartography in the Low Countries during the Renaissance', in The History of Cartography, vol. 3, part 2 (Chicago 2007), pp. 1384–1432. press.uchicago.edu
- Roel Nicolai, 'The map projection of portolan charts', Nieuw Archief voor Wiskunde 5/22, no. 1 (2021), pp. 33–41. nieuwarchief.nl
- Marco van Egmond, 'Thresoor der zeevaert van Waghenaer', Utrecht University Library, Special Collections. uu.nl
- Jacob van Lennep, Zeemans-woordenboek (Amsterdam 1856), the entries streek, windstreken, kompasroos and paskaart. dbnl.org
- Review of W. F. J. Mörzer Bruyns, Konst der stuurlieden (2001), in Bijdragen en Mededelingen betreffende de Geschiedenis der Nederlanden 118 (2003). dbnl.org
- Edward Wright, Certaine Errors in Navigation (London 1599): not read by us, cited after Ash.